Module 12: Understanding InaSAFE
Learning Objectives
Understand the concept of hazard, exposure and impact data
Understand how to determine impact
Understand the InaSAFE interface
Add hazard data
Add unprocessed exposure data (vector and raster)
Use the keywords editor
Analyse impact
Improve InaSAFE output map
Save and print scenario results
1. Hazards, exposure and impact
Let’s begin by reviewing the inputs and outputs of InaSAFE - hazard, exposure, and impact. These terms are important for you to remember because the analysis process depends on these three things.
Hazards (also called disasters) are what we call the data layers that describe the extent and magnitude of natural events (such as earthquakes, tsunamis and volcanic eruptions) that could potentially cause an event or series of events that threaten and disrupt the lives and livelihoods of people.
In general, the hazard data we use in InaSAFE represents a single hazard scenario. A scenario means that the hazard:
is at a particular location
has a measured intensity
has a measured duration
has a certain time frame
In this module we will use a dataset modelled from an earthquake in Lembang.
Note
The earthquake modelling was done by experts. InaSAFE is not a hazard modelling tool.
Exposure data represents things that are at risk when faced with a potential hazard. This can be man-made features such as public buildings, houses, roads and bridges, or it can be so-called natural features, such as population, rice paddies and lakes. These exposed elements can be divided into various categories, including physical elements (houses, power lines), economic elements (agricultural land, access to employment), social elements (vulnerable groups, population count), and environmental elements (air, water, plants and animals).
Impact is the result we get after InaSAFE processes the effect of the hazard data upon the exposure data. For example, if there is an earthquake model in Lembang, and we process it against building data in Bandung, our impact layer may show those houses that would be severely damaged, those somewhat damaged, and those mildly damaged. In other words, what goes in to InaSAFE are hazards and exposure. What comes out is impact.
2. The InaSAFE interface
Before we run any scenarios, let’s take a closer look at the InaSAFE interface.
First make sure that you’ve installed the InaSAFE plugin. Follow the plugin instructions in module 4. Find and install the plugin called InaSAFE.
Open a new project in QGIS.
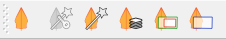
If the InaSAFE toolbar is not visible, right-click on the toolbars and make sure that InaSAFE plugin is checked. The toolbar looks like this:
To show the InaSAFE panel, click on the Toggle InaSAFE dock button.

Note
Just like QGIS toolbars, you can drag and drop the InaSAFE dock panel to change its position in the QGIS interface. You can pull it away as a separate window, or place it below the Layers panel. It’s convenient in its location on the right side of QGIS, so we will leave it there.
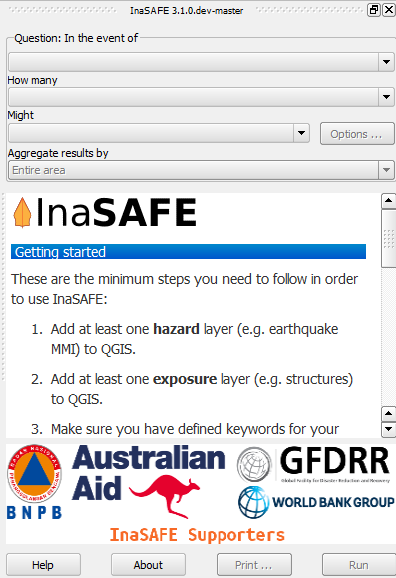
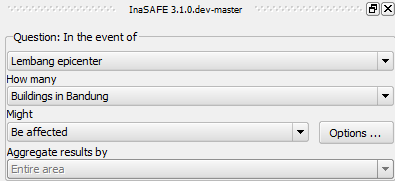
The InaSAFE panel consists of three parts: Questions, Results and Buttons. The questions are mixed in with drop-down boxes - this is where we establish our input data and define the scenario that we want InaSAFE to process. The purpose of InaSAFE is to make your impact analysis very simple and easy to do. The Questions section provides a simple way for you to formulate what you want to know. All questions are created in the following format:
In the event of [hazard] how many [exposure] might [impact]?
For example: “In the event of an earthquake how many buildings might be destroyed?”
The Results section is filled in with information after InaSAFE is run, as we shall see. The buttons at the bottom allow us to run a scenario, print and access help.
3. Adding hazard data
Hazards can be represented by vector layers or by raster layers. Remember that raster layers are like images with many pixels, and each pixel represents some data about an area on the ground. A raster that shows elevation, for example, will contain pixels with different values based on the altitude of the location. Similarly, a raster that represents an earthquake will contain the magnitude of the earthquake at the time of the event in every pixel in the raster.
An earthquake can also be modelled with vector data, although the detail of the data will most likely be lower. In this case vector polygons represent the area where the earthquake occurred, and various polygons may show areas of differing magnitudes.
Let’s begin by adding our hazard layer to QGIS. It’s a raster model of an earthquake in Lembang.
Click the Add Raster Layer button.

Navigate to the
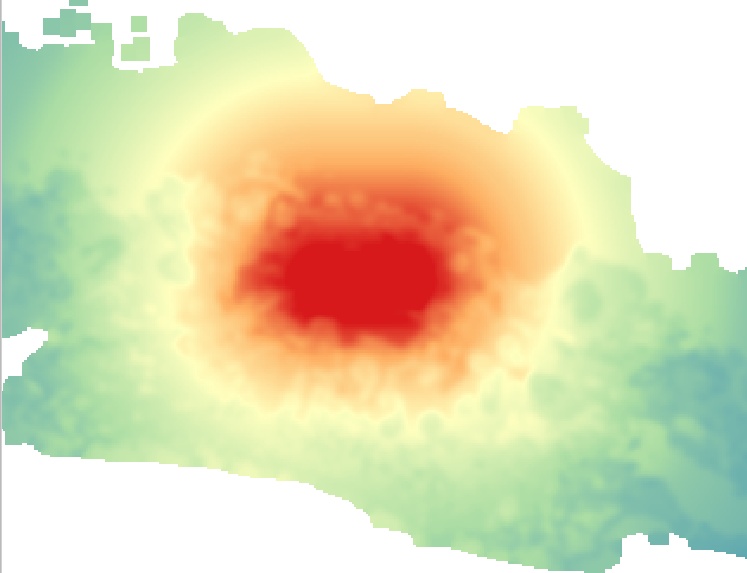
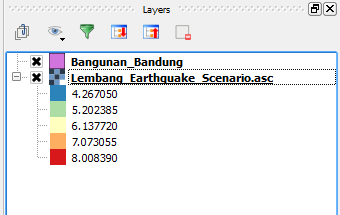
qgis/Bandung/folder and addLembang_Earthquake_Scenario.asc. This data is raster data (in ASCII format) which represents the magnitude of the earthquake. The layer will look like this:
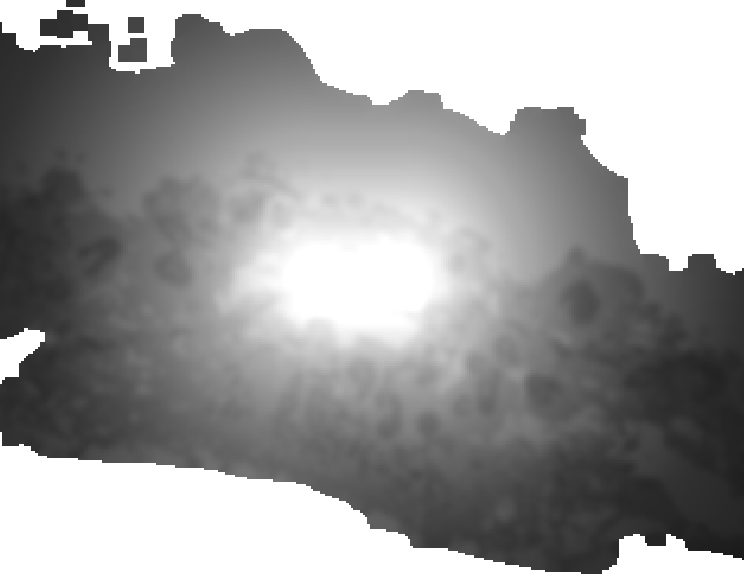
Try to change the layer band into Singleband Pseudocolor so that the layer looks like the image below (refer to module 8, if you forgot how!):
You will notice that the hazard drop-down box has been automatically filled in the InaSAFE panel. This is because the data file has already been prepared for us with keyword metadata (fancy words for settings) that tells InaSAFE whether it’s a hazard or exposure layer. When we add the exposure data, we will learn how to add these InaSAFE keywords ourselves.
4. Exposure
Exposure can also be represented by vectors or rasters.
Let’s add our exposure data to QGIS - we will be using buildings obtained from OpenStreetMap.
Click on the Add Vector Layer button.

Add the file
Bangunan_Bandung.shp, which is located in theqgis/Bandung/folder.
Notice that unlike the hazard layer, it does not appear automatically in InaSAFE!
5. Adding keyword metadata
In order for InaSAFE to know that our layers are hazard or exposure datasets, we need to assign keywords to the layers using the InaSAFE Wizard tool. Let’s take a look at the keywords that have already been created on the hazard layer.
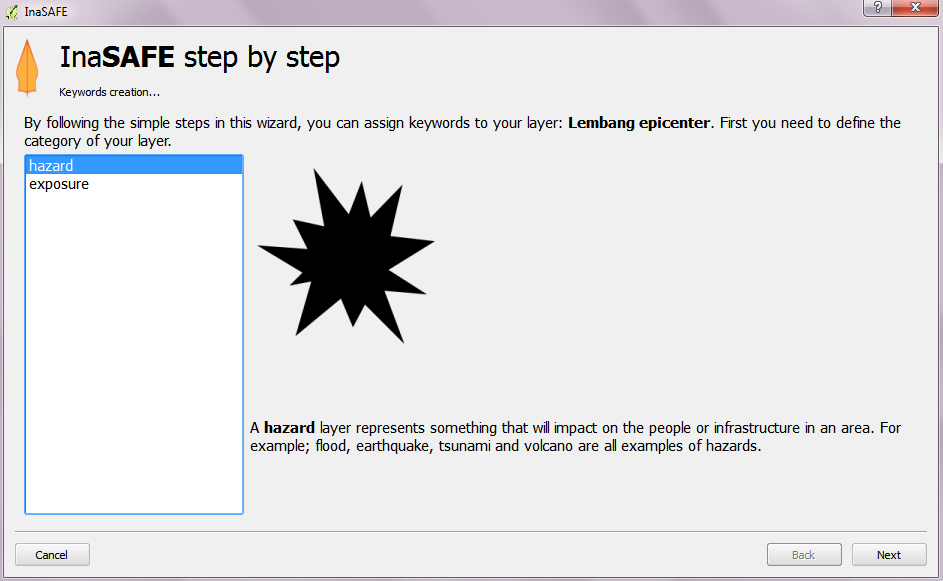
Select the earthquake layer in the Layers panel, and click on the InaSAFE Wizard button.

In the InaSAFE Wizard window, we can follow the existing instructions step by step and change several keyword fields.
Click OK.
Select the Bangunan_Bandung layer and open the Wizard.
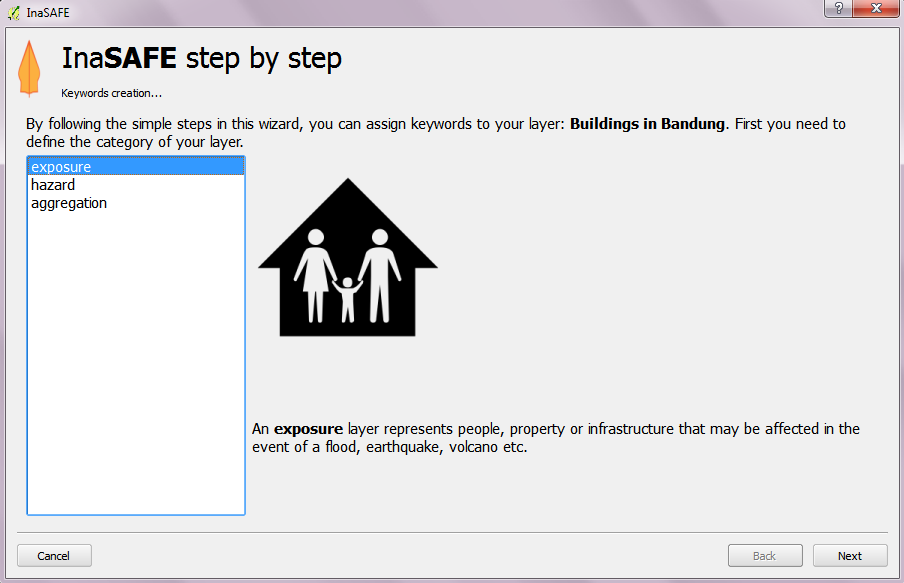
Notice that title and category are set, but not the subcategory.
Change the subcategory to structure, and click OK.
Notice that the layer now appears in the InaSAFE panel.
6. Impact Analysis
Now our hazard and exposure data are set in the InaSAFE panel, because the appropriate keywords have been added to our layers. Note that if we were to add a second exposure layer to our project, we would be able to choose which exposure layer we wanted from the InaSAFE drop-down menu. The same applies to hazard layers.
The third drop-down box is the impact function (“Might”). This concludes our question, and defines the function that InaSAFE will run behind the scenes. InaSAFE developers have written many of these functions to analyse all sorts of hazard and exposure layers. The function that is selected for us here will process the hazard and exposure layers spatially to determine how the exposure layer will “be affected.”
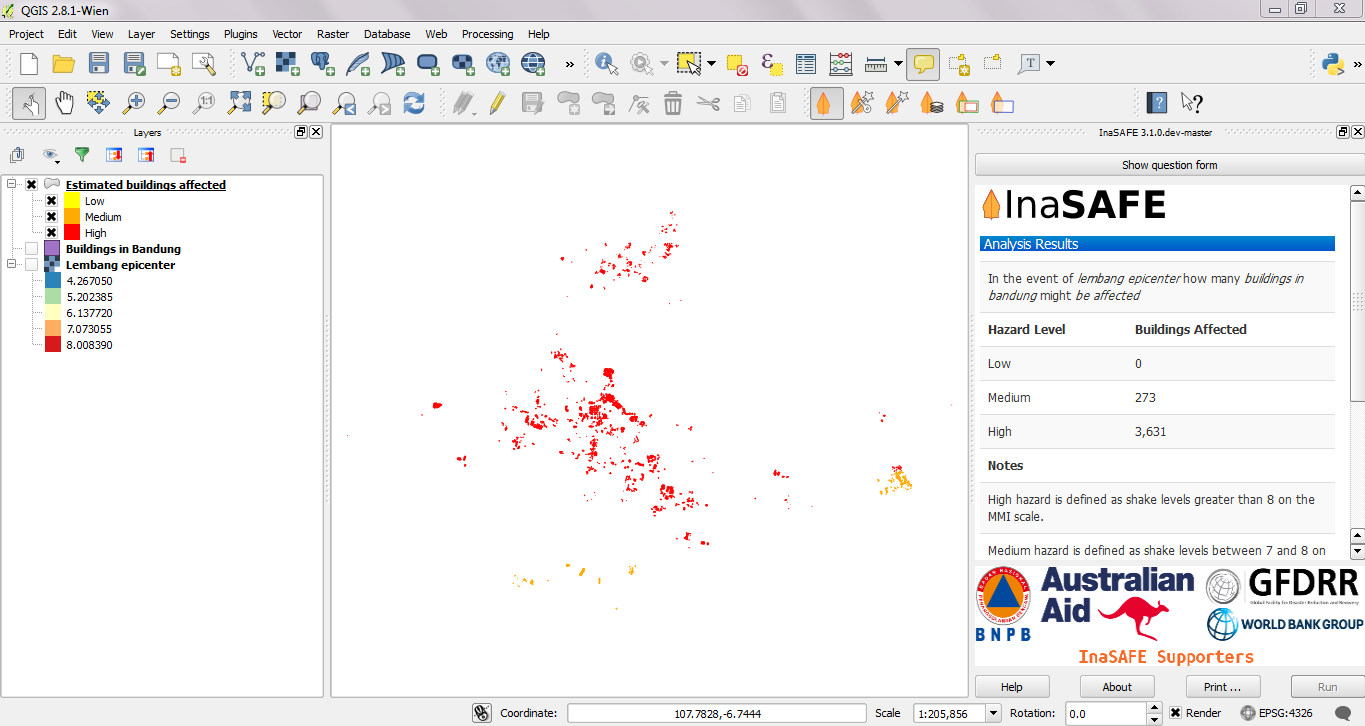
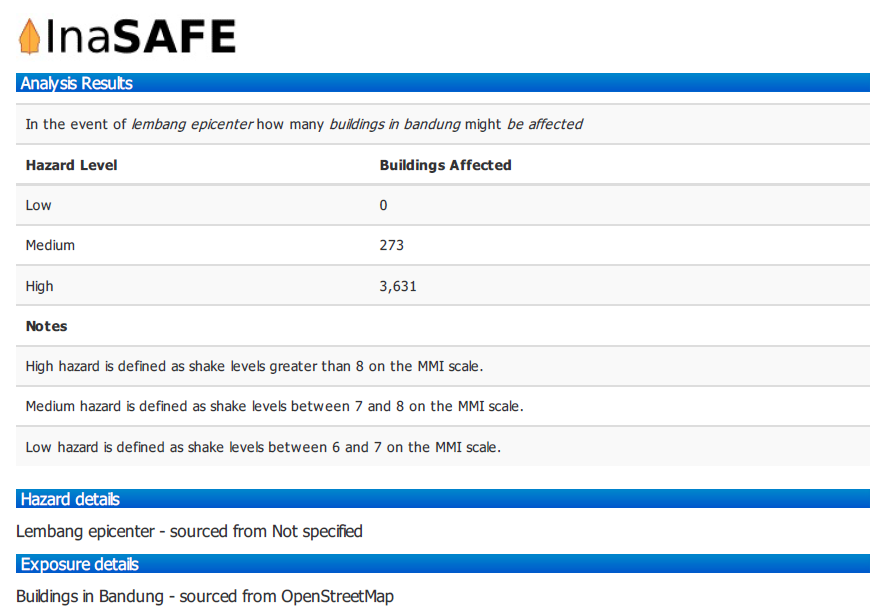
Click the Run button at the bottom to start the impact analysis. At the end of the process, the statistics will be displayed in the Results section, and a new layer will be added to the Layers panel that describes the result of the analysis. The map will distinguish between buildings that are affected and those that are not.
7. Improve the InaSAFE output map
We can improve our impact map by editing the symbology in QGIS. Styles can be changed, other relevant layers can be added, and the layout can be changed using the Print Composer.
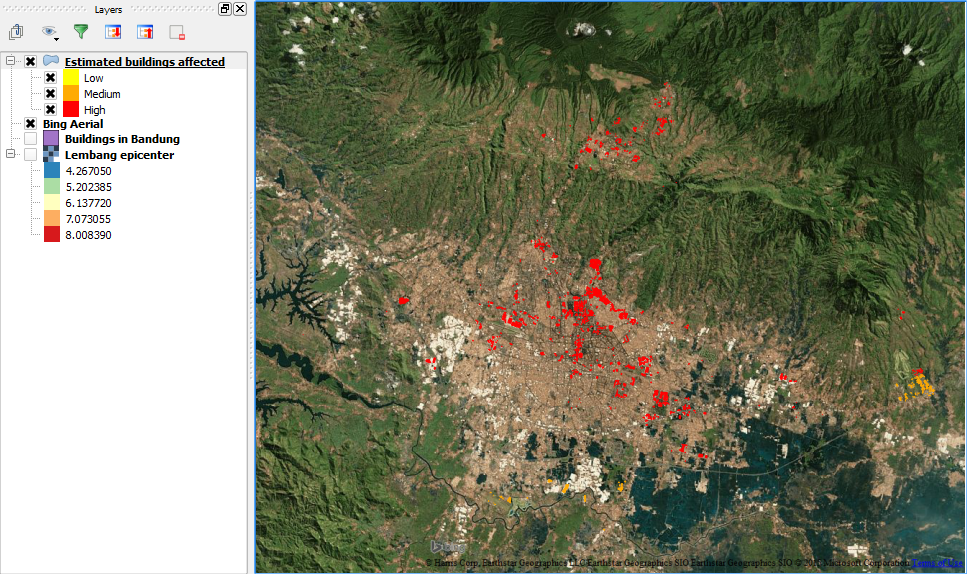
Let’s add Bing aerial imagery as a background for our map.
Go to .
Drag the layer below your new impact layer. If the buildings don’t show correctly above the imagery, right-click on the layer and click Update drawing order.
8. Using the print button
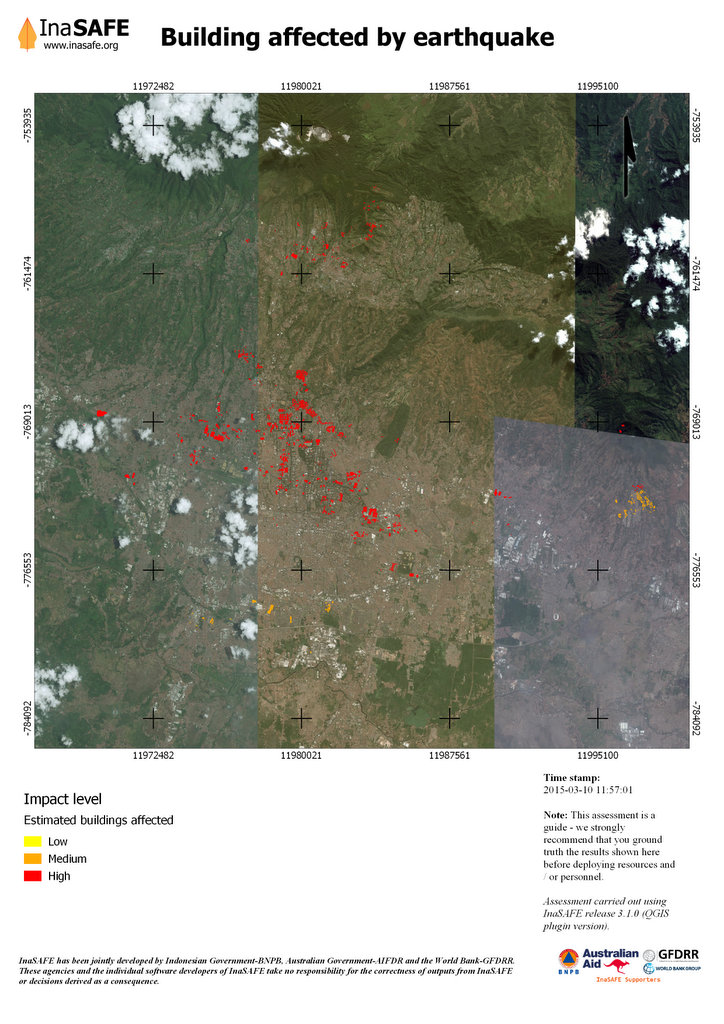
The data displayed on the screen can be saved to a PDF file by clicking Print at the bottom of the InaSAFE panel.
Click on the InaSAFE result layer and then click Print.
A window will appear, in which you can choose the extent to be printed. Choose Analysis extent if you want to print the entire map extent, or choose Current extent to print the analysis based on the current view of the map.
You may also choose a custom print template inasafe-potrait-a4.
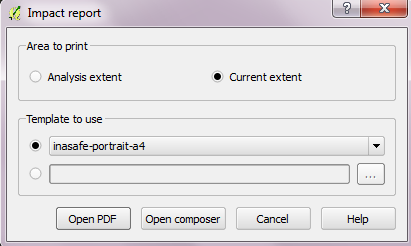
If you want to add additional information before printing, click Open Composer.
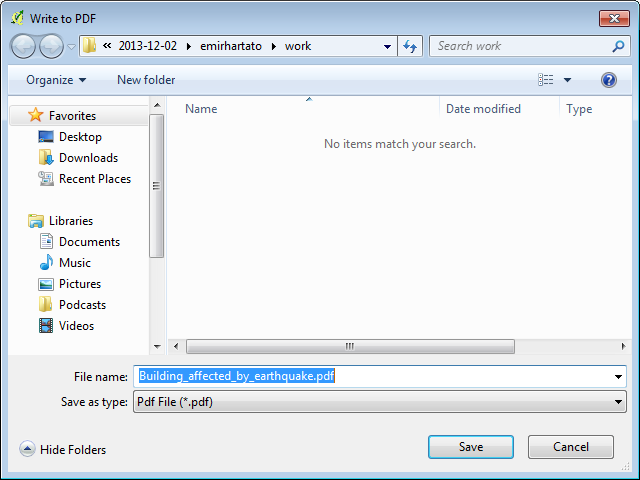
To save it in PDF format for printing, click Open PDF.
Choose your save location and click Save.
9. Save your results
You can save the impact layer that InaSAFE created, and you can save the QGIS project to come back to it later, but note that the InaSAFE statistics cannot be saved (except when you save them in a PDF). To get the statistics again in QGIS, you will need to run the analysis again.
To save the newly generated layer, right-click on it in the Layers panel. Click Save As…
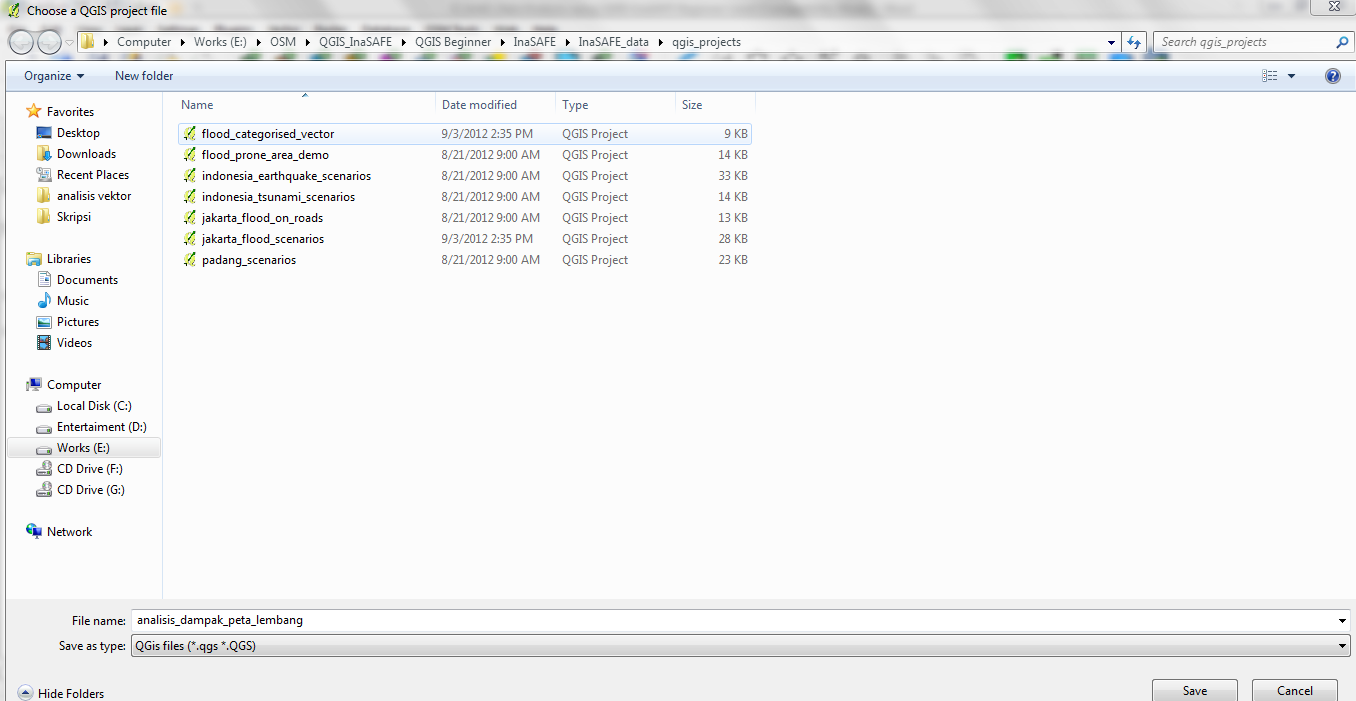
Select a name and location for the file. Click OK.
To save the project, click on the Save Project button at the top of QGIS.

Give a name to the project and put it in the directory where you want to save your work. Then click Save.