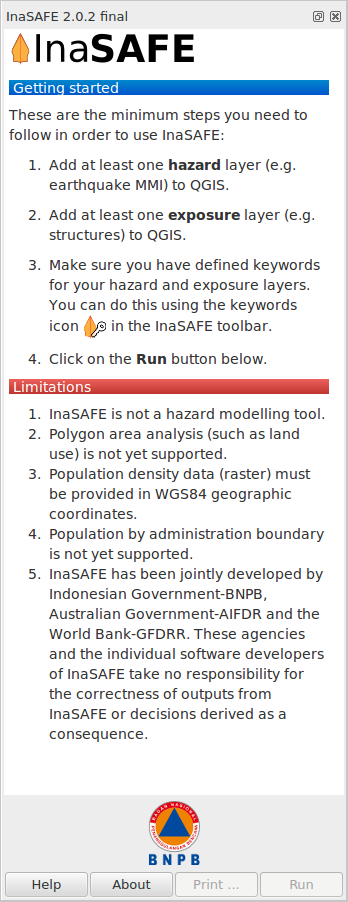
InaSAFE Panel
This document describes the usage of the InaSAFE ‘dock panel’ - the primary interface for running risk scenarios within the QGIS environment.
Note
In order to use InaSAFE effectively, you should also read the Keywords System and Understand Impact Functions documentation before getting started.
The InaSAFE dock panel is the main way to interact with the tools that are provided in InaSAFE. After you have installed the InaSAFE plugin, the dock panel will automatically load in QGIS and appear somewhere on your screen. It looks like this:
Docking Panel
Drag and drop the dock panel to reposition it in the user interface. For example, dragging the panel towards the right margin of the QGIS application will dock it to the right side of the screen.
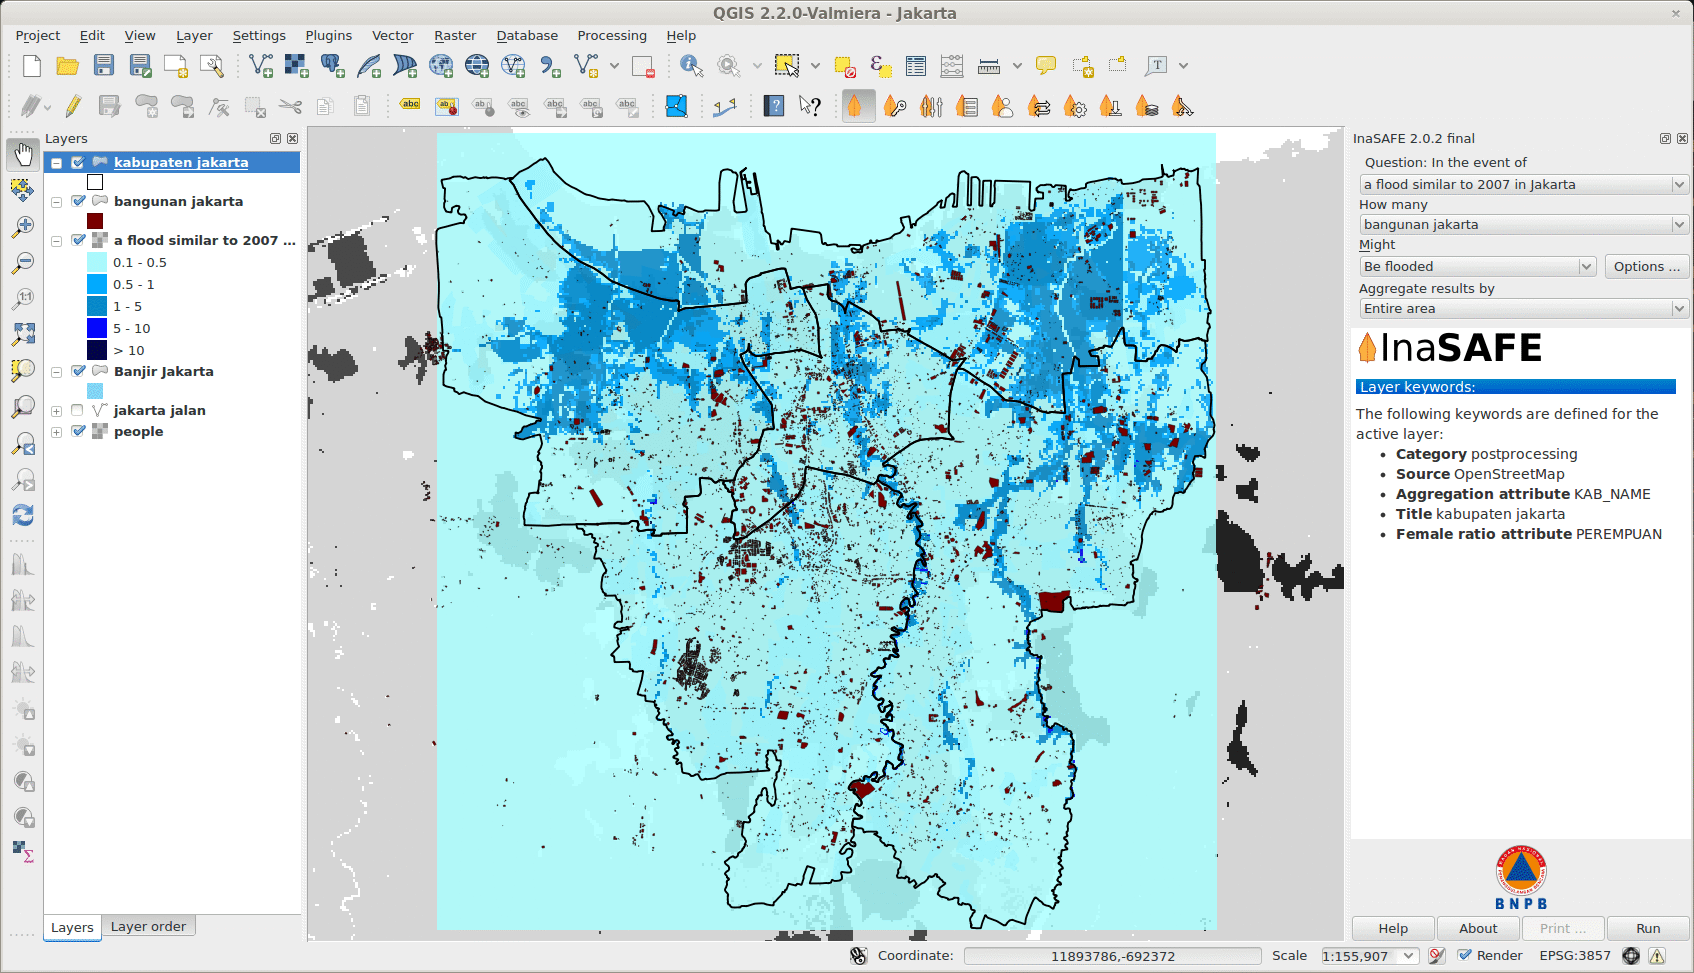
Dock positioned on the right with a project loaded
There are three components within the panel:
the Questions area
the Results area
the Buttons area
At any time you can obtain help in InaSAFE by clicking on the Help buttons provided on each dock and dialog.
The questions area
The objective of InaSAFE is to make it easy to perform an impact analysis. The questions area provides a simple way to formulate the scenario question. All questions are formulated in the form:
If [hazard] how many [exposure] might [impact].
For example:
If there is a flood how many schools might be closed.
In order to answer such questions, the InaSAFE developers have built a number of impact functions that cover scenarios such as flood, tsunami, volcanic ash fall, earthquake and more. Visit Understand Impact Functions for detailed information on each impact function.
To formulate these questions, various layers must be loaded into QGIS that represent either hazard or exposure information.
A hazard (In the event of) may be represented as, for example, a raster layer in QGIS where each pixel in the raster represents the current flood depth following an inundation event.
An exposure (How many) layer could be represented, for example, as vector polygon data representing building outlines, or a raster outline where each pixel represents the number of people resident in that cell.
The impact function (Might) will combine these two input layers in a mathematical model in order to postulate what the impacts of the hazard will be on the exposure infrastructure or people.
By selecting a combination from the In the event of and How many combo boxes, an appropriate set of impact functions will be listed in the Might combo box.
How does the InaSAFE plugin determine whether a layer should be listed in the In the event of or How many combo boxes? The plugin relies on simple keyword metadata associated with each layer.
The keyword system is described in detail in Keywords System. Each layer that has a keyword defining its category as hazard will be listed in the In the event of combo box. Similarly, a category of exposure in the keywords will result in a layer being listed under the How many combo box.
InaSAFE uses the combination of category, subcategory, units and datatype keywords to determine which impact functions will be listed in the Might combo box.
The impact function can be configured (if applicable) by pressing the … button next to the chosen impact function.
This is explained in more detail below under Setting analysis parameters.
As of InaSAFE 1.2, you can also choose an aggregation layer for both raster and vector layers.
Aggregation allows you to specify an additional layer when defining the analysis criteria. This layer is used to provide a by-area breakdown of the results of the analysis. For example, if you are carrying out an analysis for a city, you can use district areas within the city to provide per-area results. In the absence of an aggregation layer, the analysis extent is used as the aggregation unit. To use this option you must load a polygon layer into QGIS that represents the areas you wish to summarise by.
Note
After running an analysis, the questions area is hidden to maximise the amount of space allocated to the results area (see below). You can re-open the question area at any time by pressing the Show question form button.
The results area
The results area is used to display feedback to the user. Once an impact scenario has been run (see next section), a summary table will be shown.

Results shown after processing of scenario
If you select an impact layer (i.e. a layer that was produced using an InaSAFE impact function), in the QGIS Layers panel, this summary will also be displayed in the results area.
When you select a hazard or exposure layer in the QGIS Layers panel, the keywords for that layer will be shown in the Results area, making it easy to understand what metadata exists for that layer.
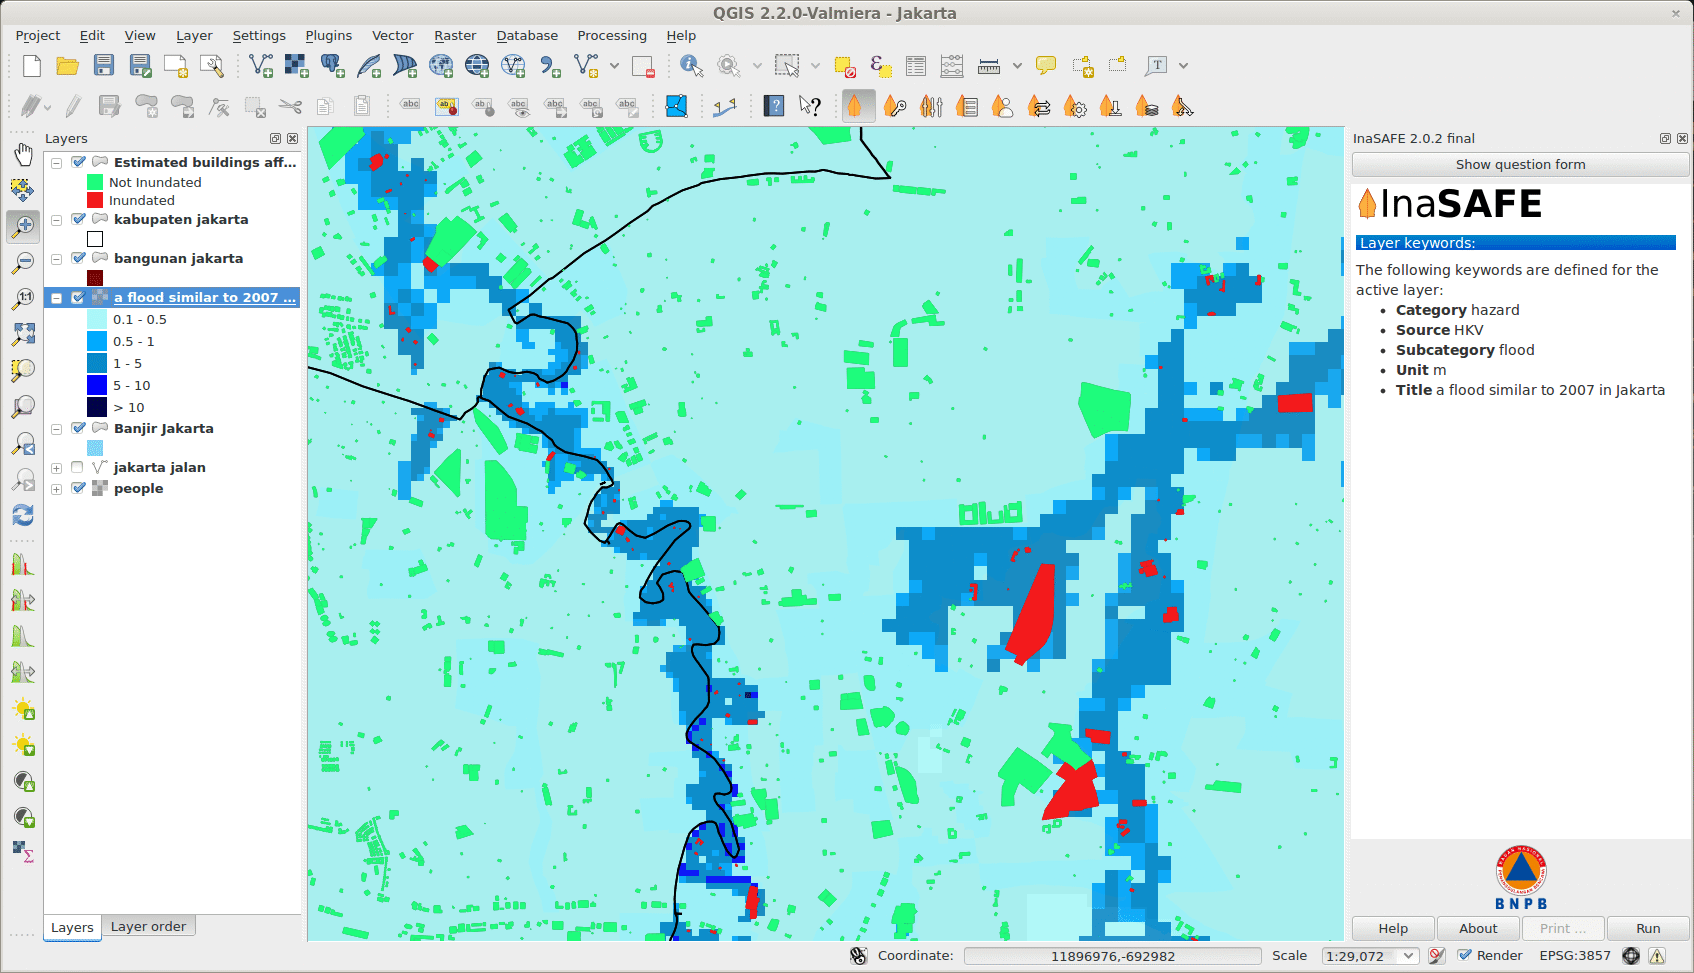
Showing keywords for active layer
The Results area is also used to display status information. For example, when a suitable combination of hazard (In the event of), exposure (How many) and impact function (In the event of) are selected, the results area will be updated to indicate that you can proceed to run the impact scenario calculation. The Run button will be activated.
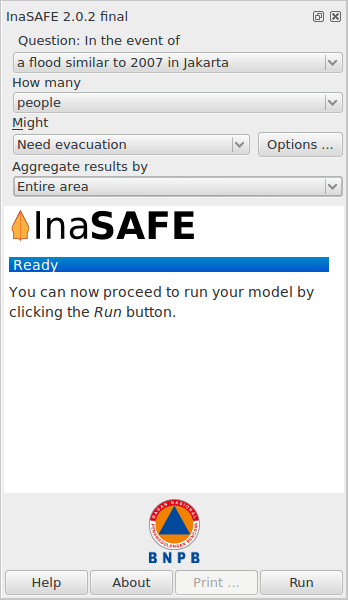
Run button activated
Finally, the results area is also used to display error messages so that the user is informed as to what went wrong and why. You may need to scroll down a bit in the window.
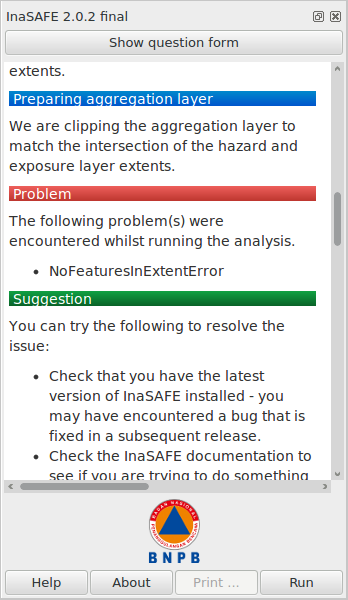
Showing error messages
To allow more space for the results your question is automatically hidden to make the results area as large as possible for displaying the results. If you want to have a look again what the question was that you formulated click on the Show question form button at the top of the results area.
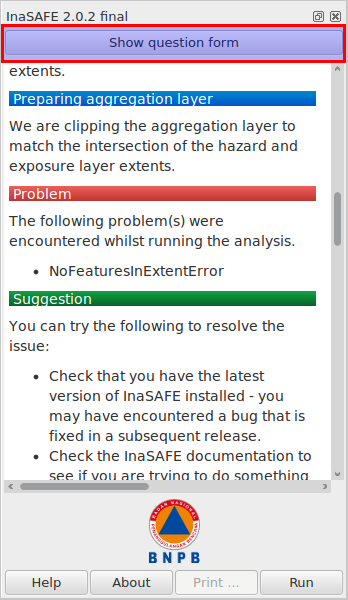
Show question form
To hide the question again to have more space for the results, simply make active the layer which InaSAFE created during the calculation in the Layers panel.
Note
At the bottom of the error display you may see a button like the following. Click on this button to display a box which contains diagnostic information that can be submitted as part of a bug report if you think the error was incorrect.

The buttons area
The buttons area contains four buttons:

Buttons Area
Help - click on this if you need context help, such as the document you are reading right now!
About - click on this to get information about InaSAFE.
Print… - click on this if you wish to create a PDF of your impact scenario project or to generate a report and open it in composer for further tuning. An impact layer must be active before this button will be enabled.
Run - when the combination of options in the questions area is suitable to be run, this button is enabled.
Data conversions when running a scenario
When running a scenario, the data being used needs to be processed into a state where it is acceptable for use by the impact function. In particular it should be noted that:
Remote datasets will be copied locally before processing
All datasets will be clipped to the intersection of the hazard layer, the exposure layer and the current view extents
All clipped datasets will be converted (reprojected) to Geographic (EPSG:4326) coordinate reference system before analysis
Setting analysis parameters
Depending on the impact function you choose there will be different options to adjust the parameters of the the question you are asking. Some impact functions have more configurable options and some have less. This depends on the impact function itself and the question you are asking.
To open the impact function configuration dialog click on the … Button next to the Might combo box.
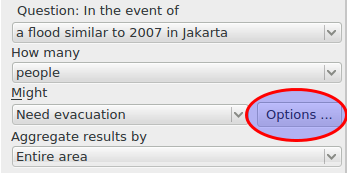
Open the impact function configurator
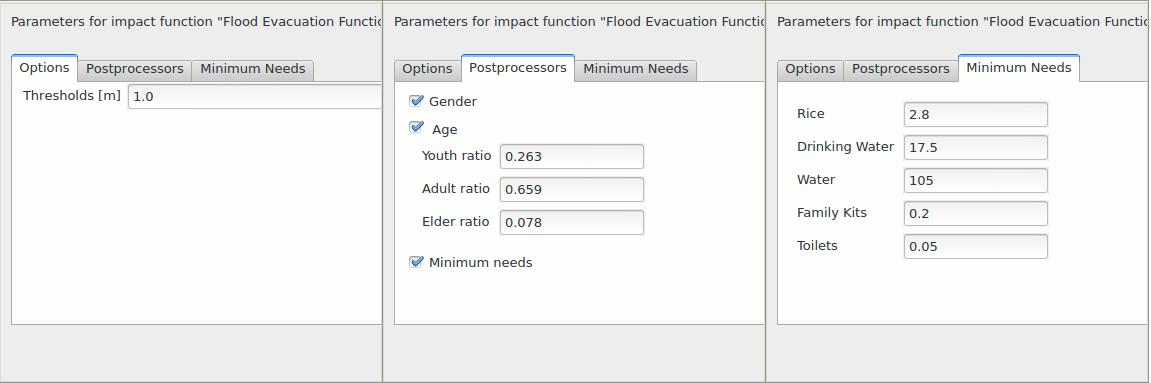
There will be up to three tabs available:
Options: Depending in the impact function you select, you can influence the result of your question here (the impact function) by setting different initial values which are presented depending on the function you choose (not all impact functions may be customised).
Postprocessors: This takes the results from the impact function and calculates derivative indicators. For example, if you have an affected population total, the gender postprocessor will calculate gender specific indicators such as additional nutritional requirements for pregnant women.
Minimum Needs: If the impact function calculates effects on people, this calculates the minimum needs of the people affected by the impact scenario. To use this you should have the necessary data available and calculate this by using the Minimum Needs Tool.
Generating impact report
When scenario analysis is complete you may want to generate a report. Usually the Print… button will be enabled immediately after analysis. If it is still inactive, select the impact layer in the Layers panel.
To generate a report click on the Print… button in the buttons area. This will open an Impact report dialog.
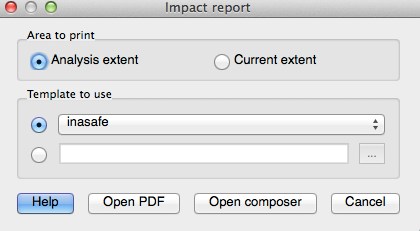
Impact report configuration
The dialog has three components:
Area to print allows you to customise the extent of the report map. There are two options available. Choose Current extent if the current canvas extent represents the necessary area. Choose Analysis extent to set the extent of the report map to the impact layer extent.
Template to use allows you to select a template for the report. The combo box lists all templates bundled with the plugin as well as templates from the user-defined template directory (see Options for information on how to set the templates directory). It is also possible to select a custom template from any location - activate the radio button under the combo box and provide a path to the template using the … button.
At the bottom are four buttons: Open PDF will generate the report and export it in PDF format. The resulting file(s) will be opened in your default PDF viewer. Open composer is used when you need to adjust the generated report before printing. Click this button and the report will be opened in the QGIS composer, where you can edit it as needed.